Plotlines
Multiple Lines Plotting
Syntax
plotlines({x1, y1}, {x2, y2}, ...) |
xi, yi are row/column vectors of the same size. Each {xi, yi} pair define a line. |
Example
Input |
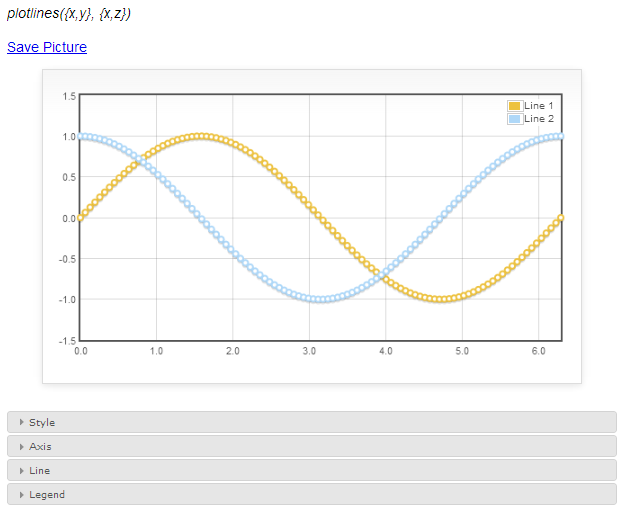
x = linspace(0, 2*PI) y = sin(x) z = cos(x) plotlines({x,y}, {x,z}) |
Output |
|
Note:
After you input the command, a new window will pop-up to show the chart. If you can not see the window and there is no error message, make sure your browser does not auto-block the pop-up window.
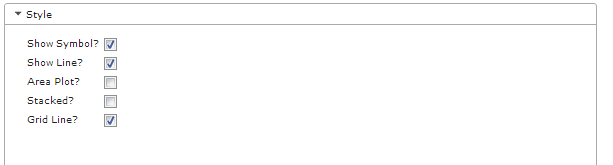
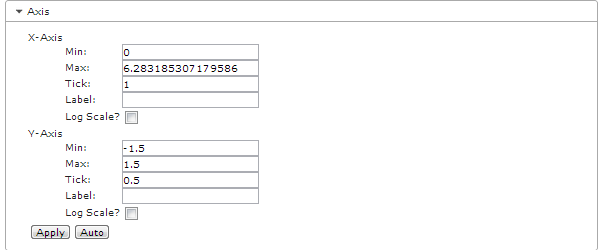
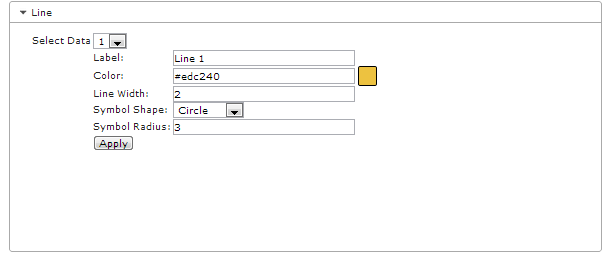
Menu:
You also can modify the looking of the chart through the following menus:

See Also
Created with the Personal Edition of HelpNDoc: Easily create HTML Help documents