Plotbars
Multiple Bars Plotting
Syntax
plotbars(x, y, ...) |
x, y, ... are row/column vectors of the same size. |
Example
Input |
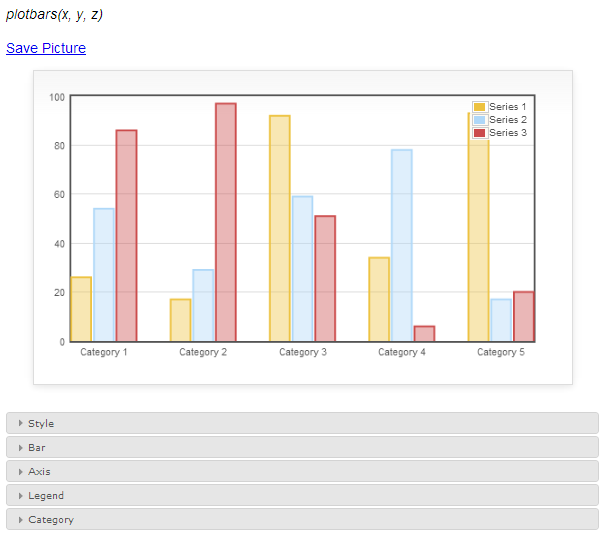
x = floor(rand(5) * 100) y = floor(rand(5) * 100) z = floor(rand(5) * 100) plotbars(x, y, z) |
Output |
|
Note:
After you input the command, a new window will pop-up to show the chart. If you can not see the window and there is no error message, make sure your browser does not auto-block the pop-up window.
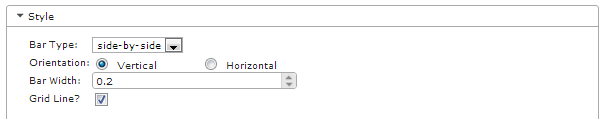
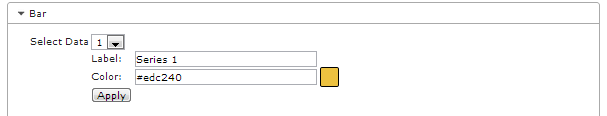
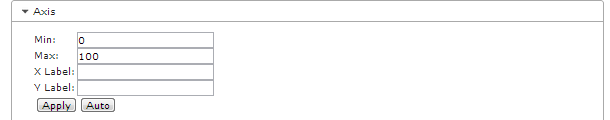
Menu:
You also can modify the looking of the chart through the following menus:


See Also
Created with the Personal Edition of HelpNDoc: Easily create EPub books